EIA oil and gas inventories
The weekly EIA reports, at a glance
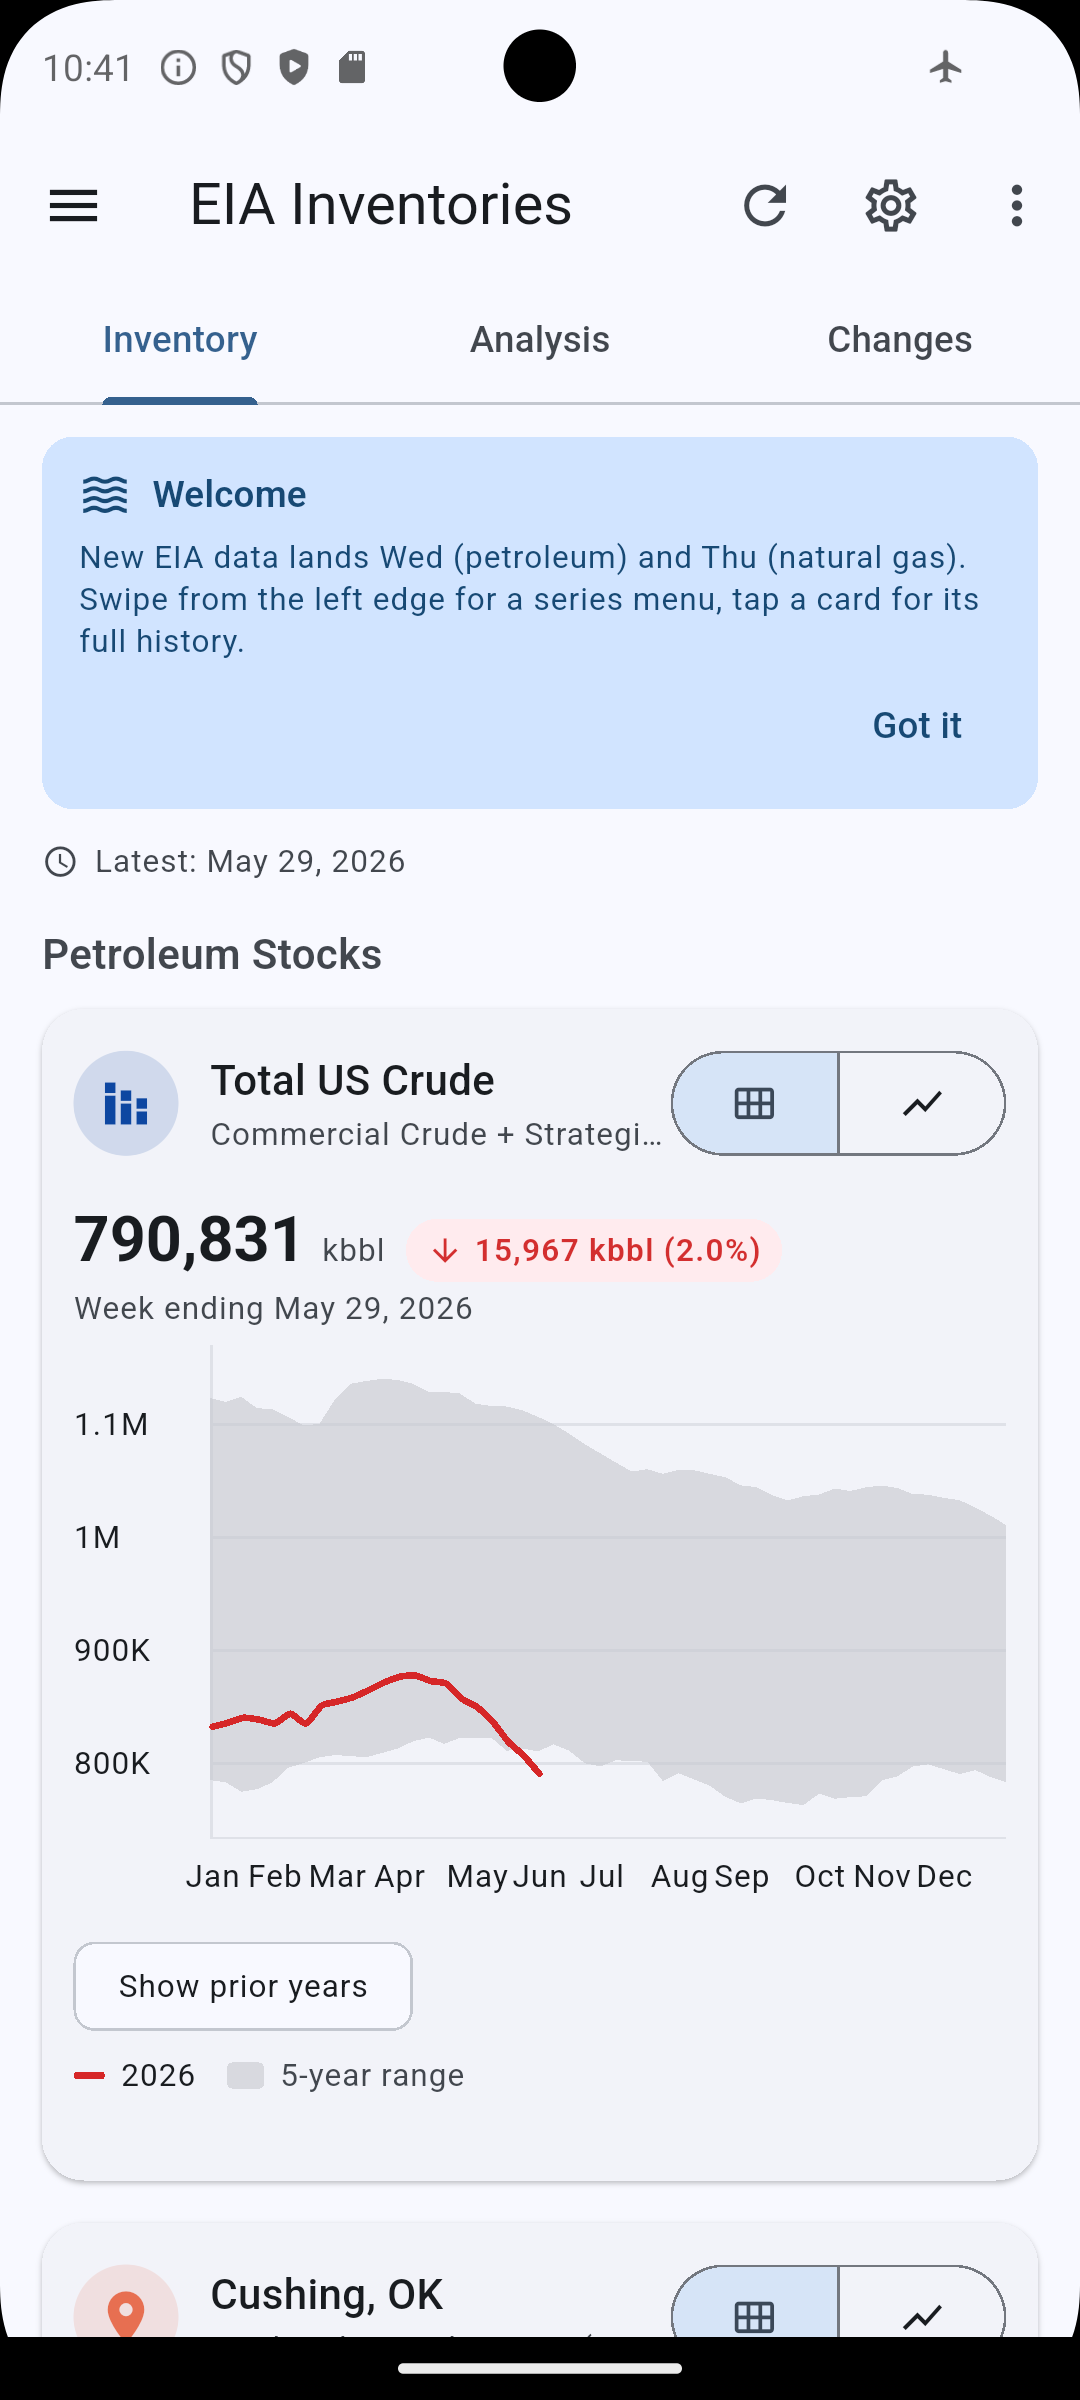
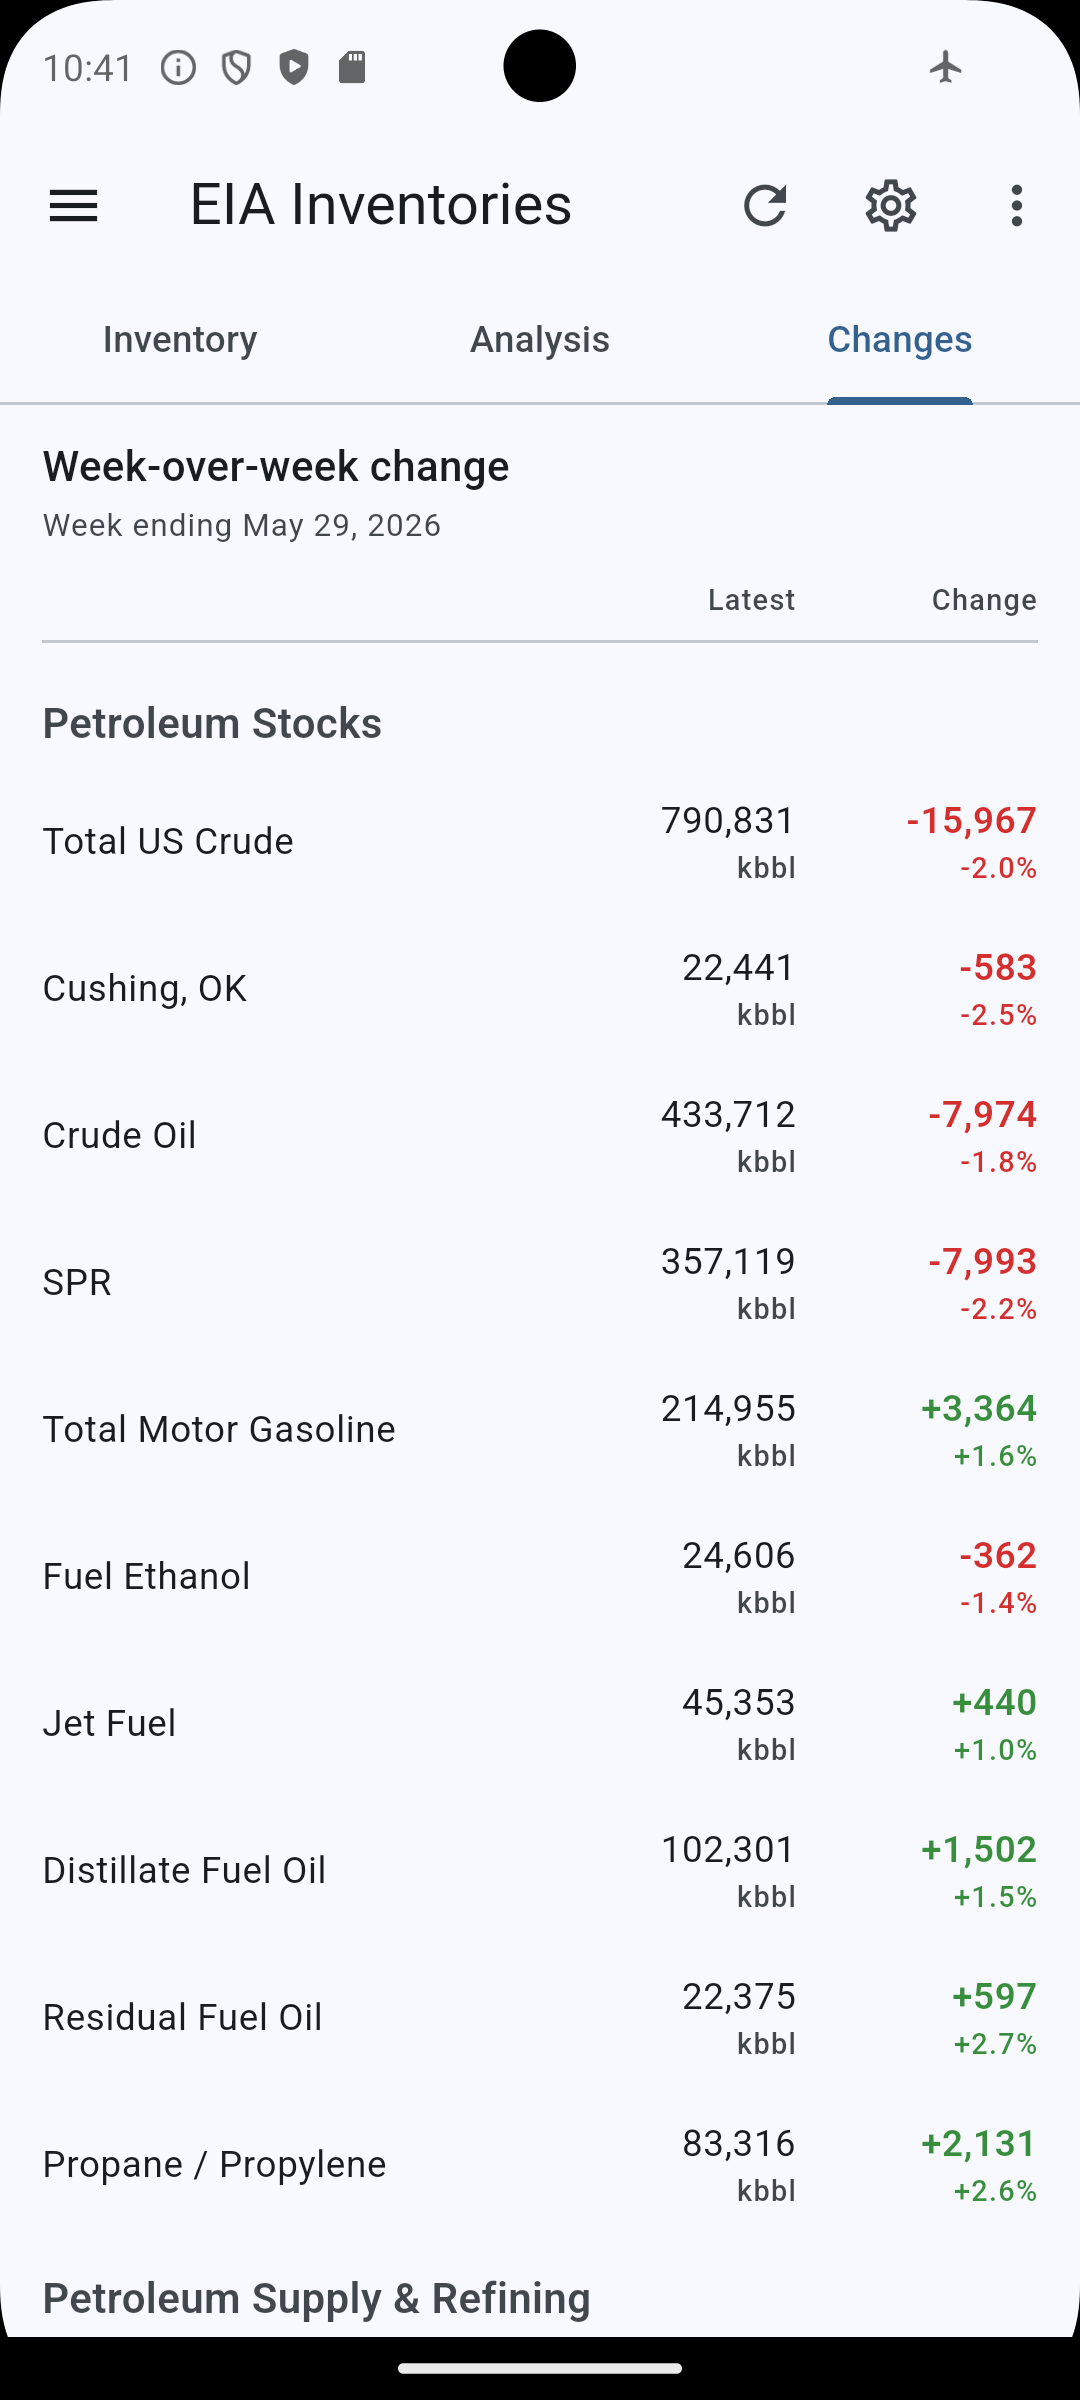
Updated within hours of every EIA release. Tap any series for full history, PADD breakdowns, and a seasonal min/max envelope.
About
EIA oil and gas inventories shows the latest U.S. Energy Information Administration (EIA) Weekly Petroleum Status Report and Weekly Natural Gas Storage Report — the same data oil and gas markets watch every Wednesday and Thursday morning — in a clean, fast mobile interface.
What you get
- Headline crude metrics, surfaced first: Total US Crude (Commercial + SPR combined), Cushing OK (WTI delivery hub), commercial Crude Oil, and the Strategic Petroleum Reserve.
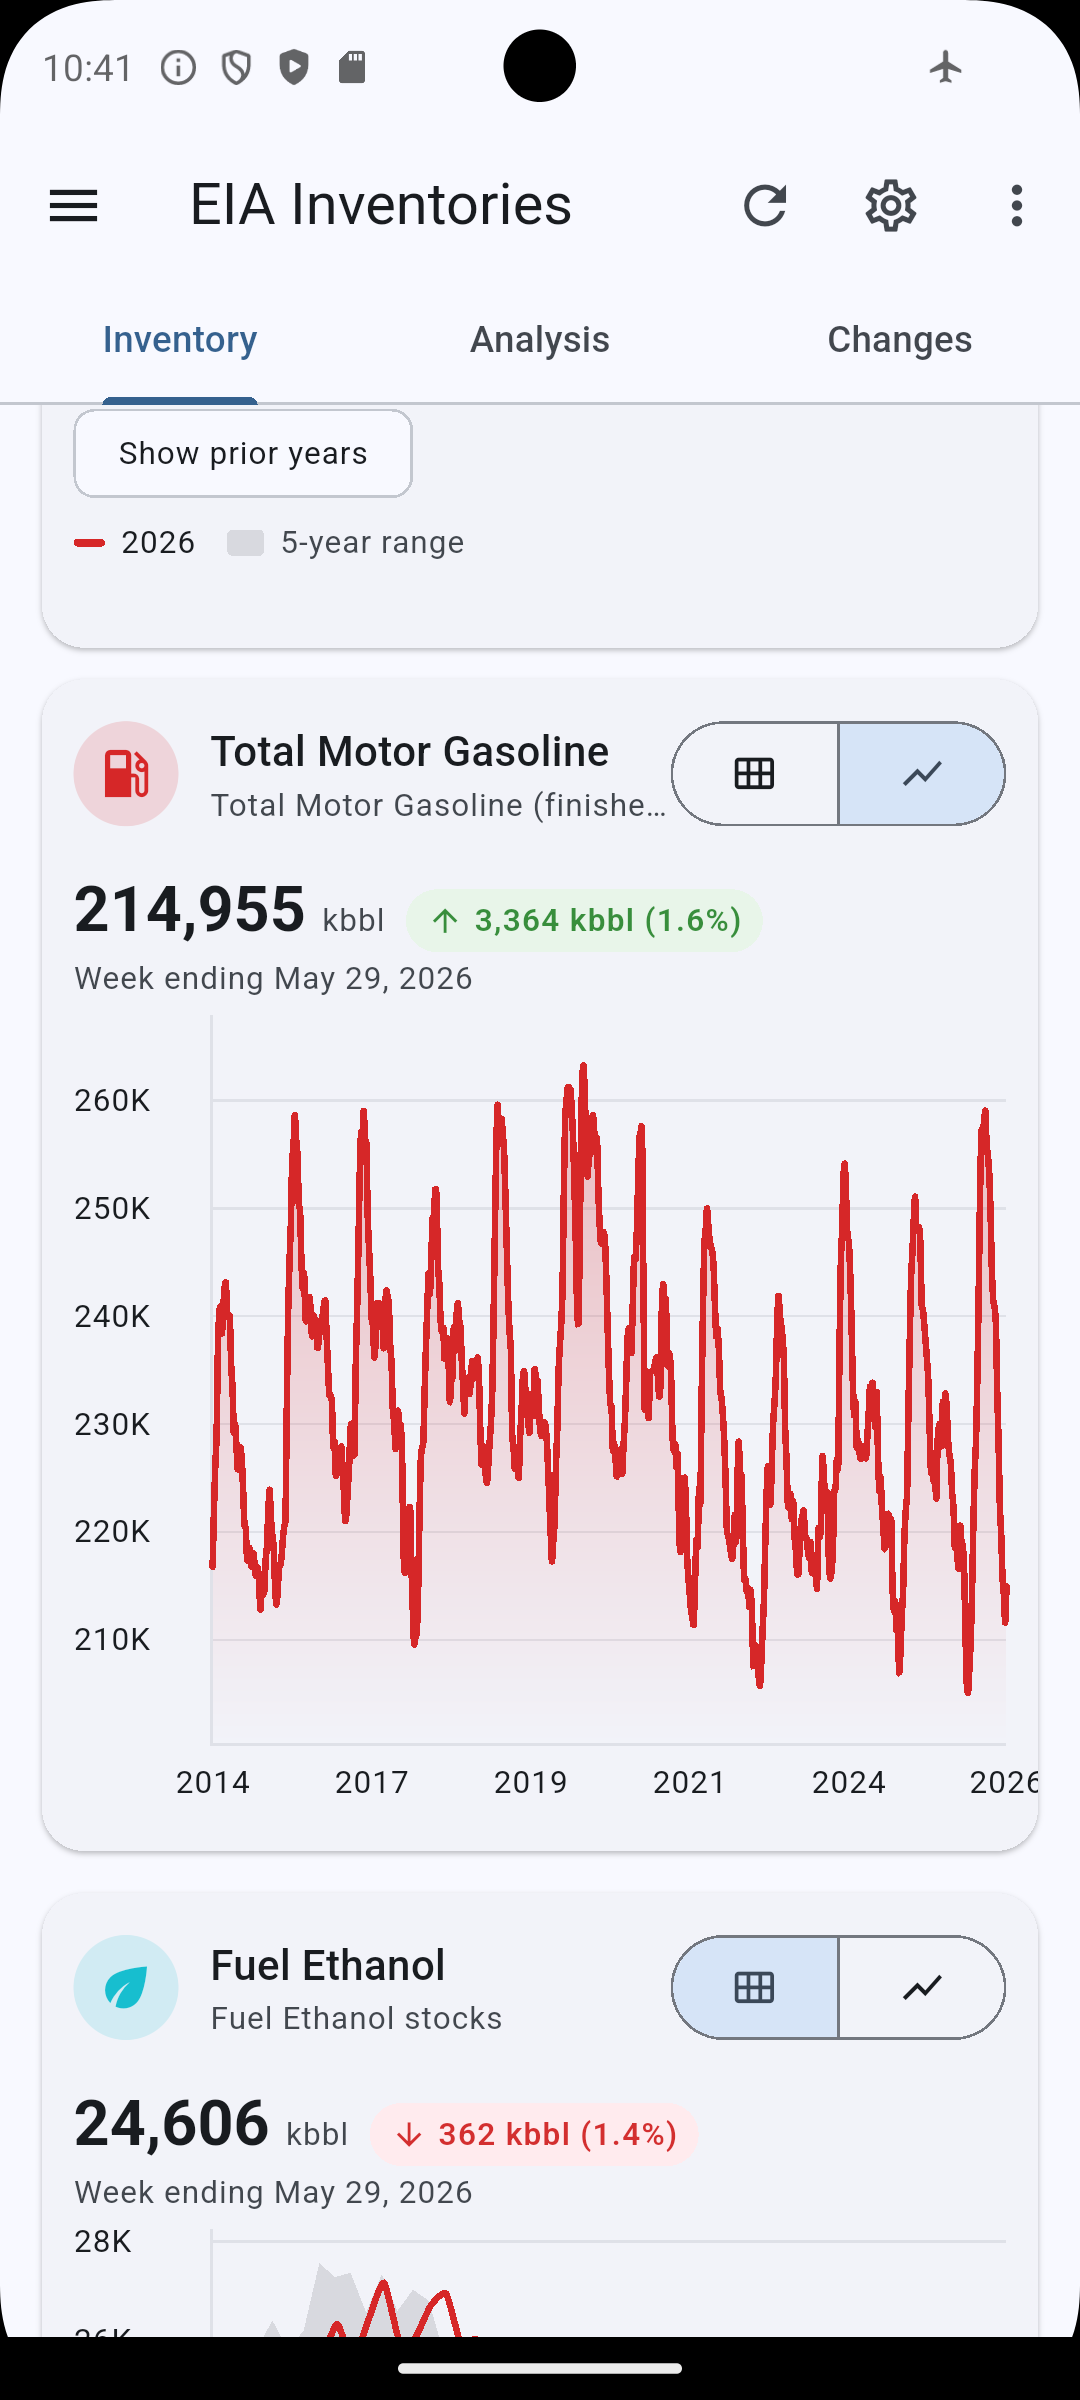
- Petroleum stocks: Total Motor Gasoline, Fuel Ethanol, Jet Fuel, Distillate Fuel Oil, Residual Fuel Oil, Propane / Propylene.
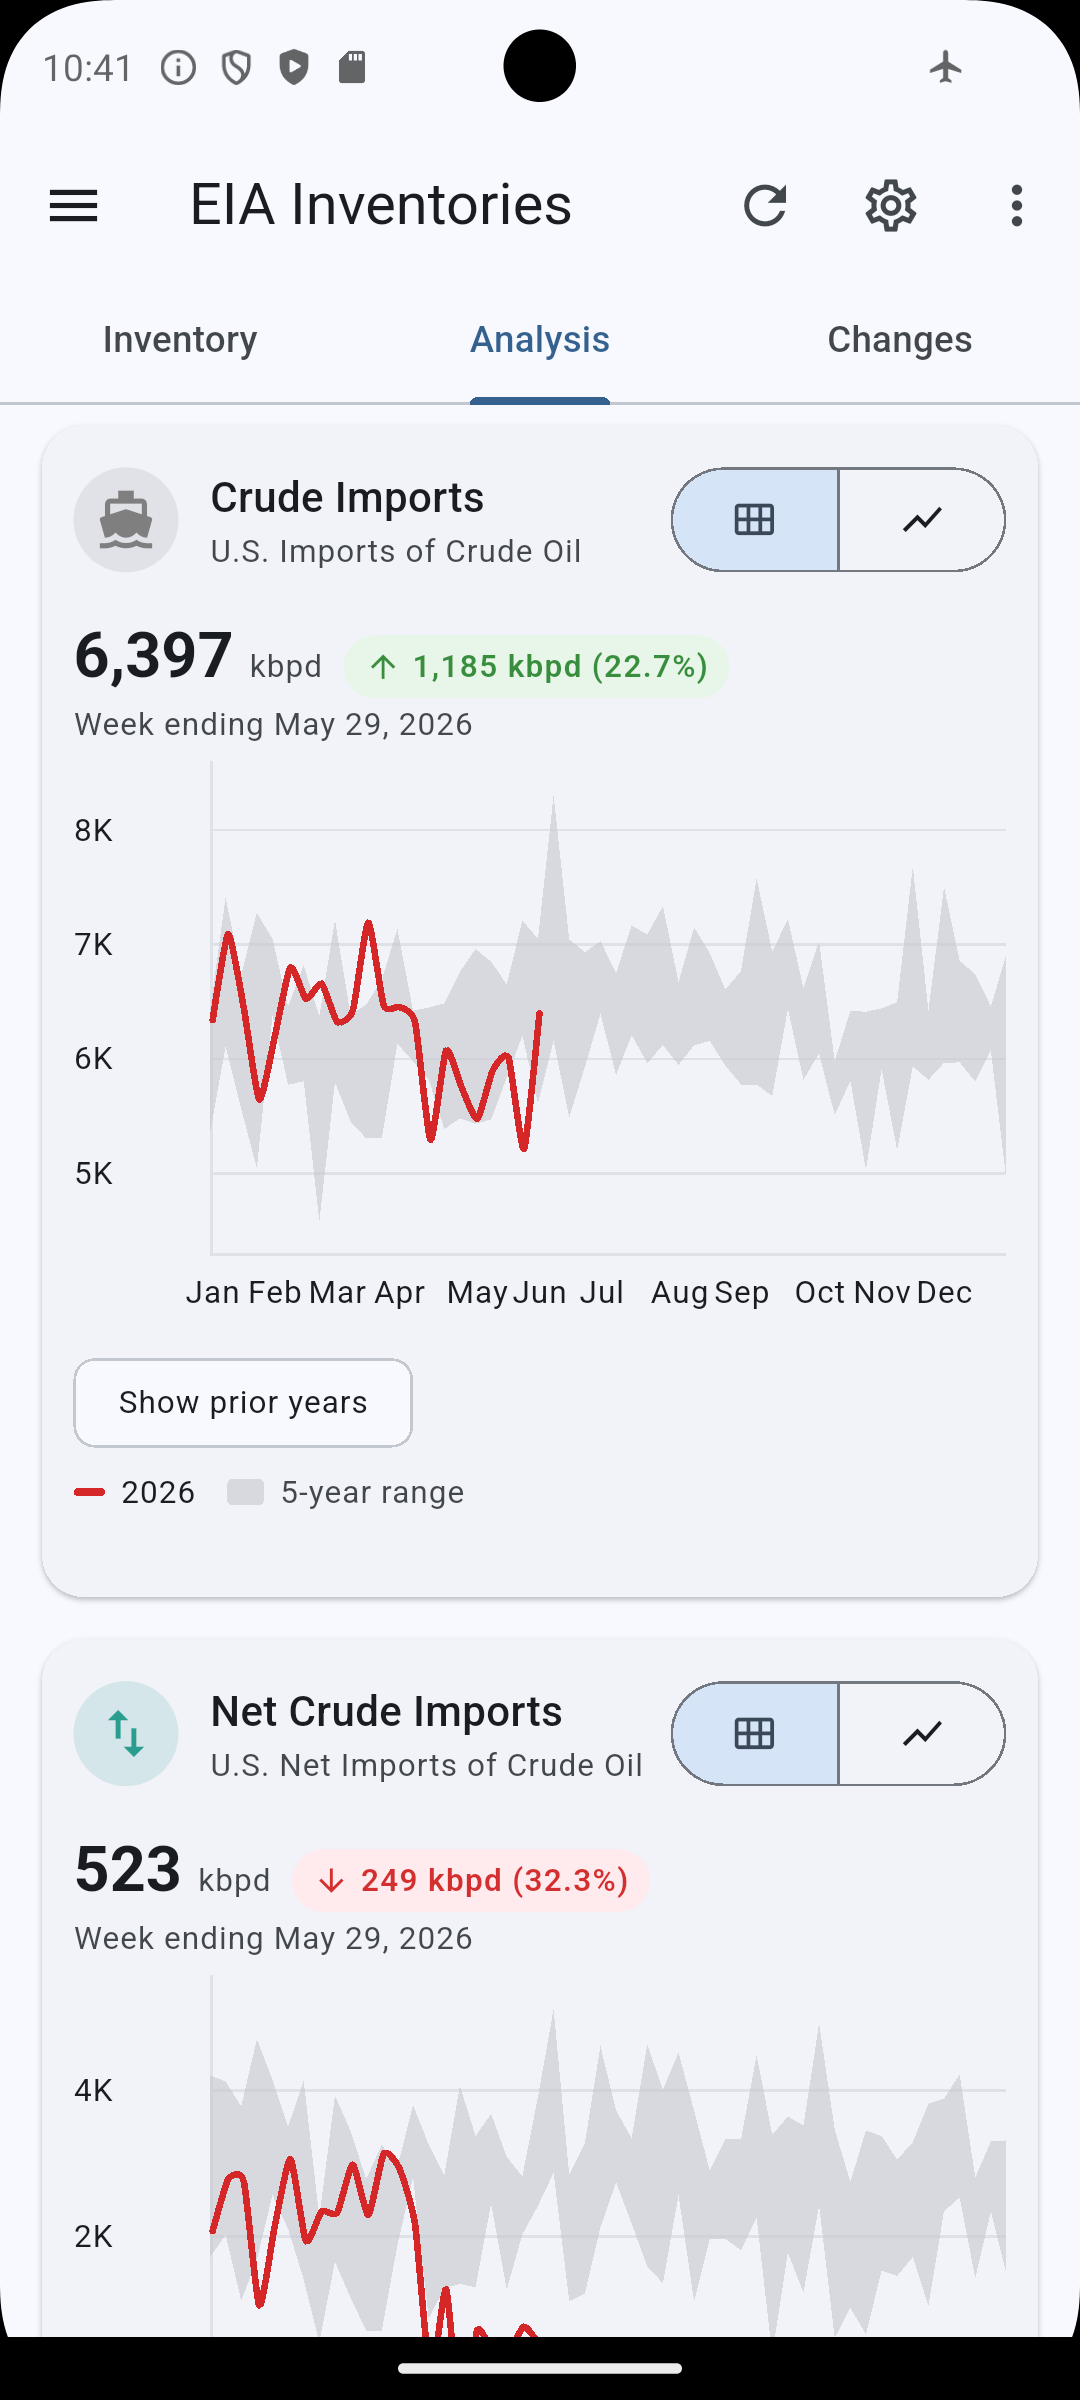
- Petroleum supply & refining: Refinery utilization rate, U.S. crude imports, net crude imports, days of cover for gasoline and distillate.
- Natural Gas: Lower 48 working storage with regional breakdowns (East, Midwest, South Central, Mountain, Pacific).
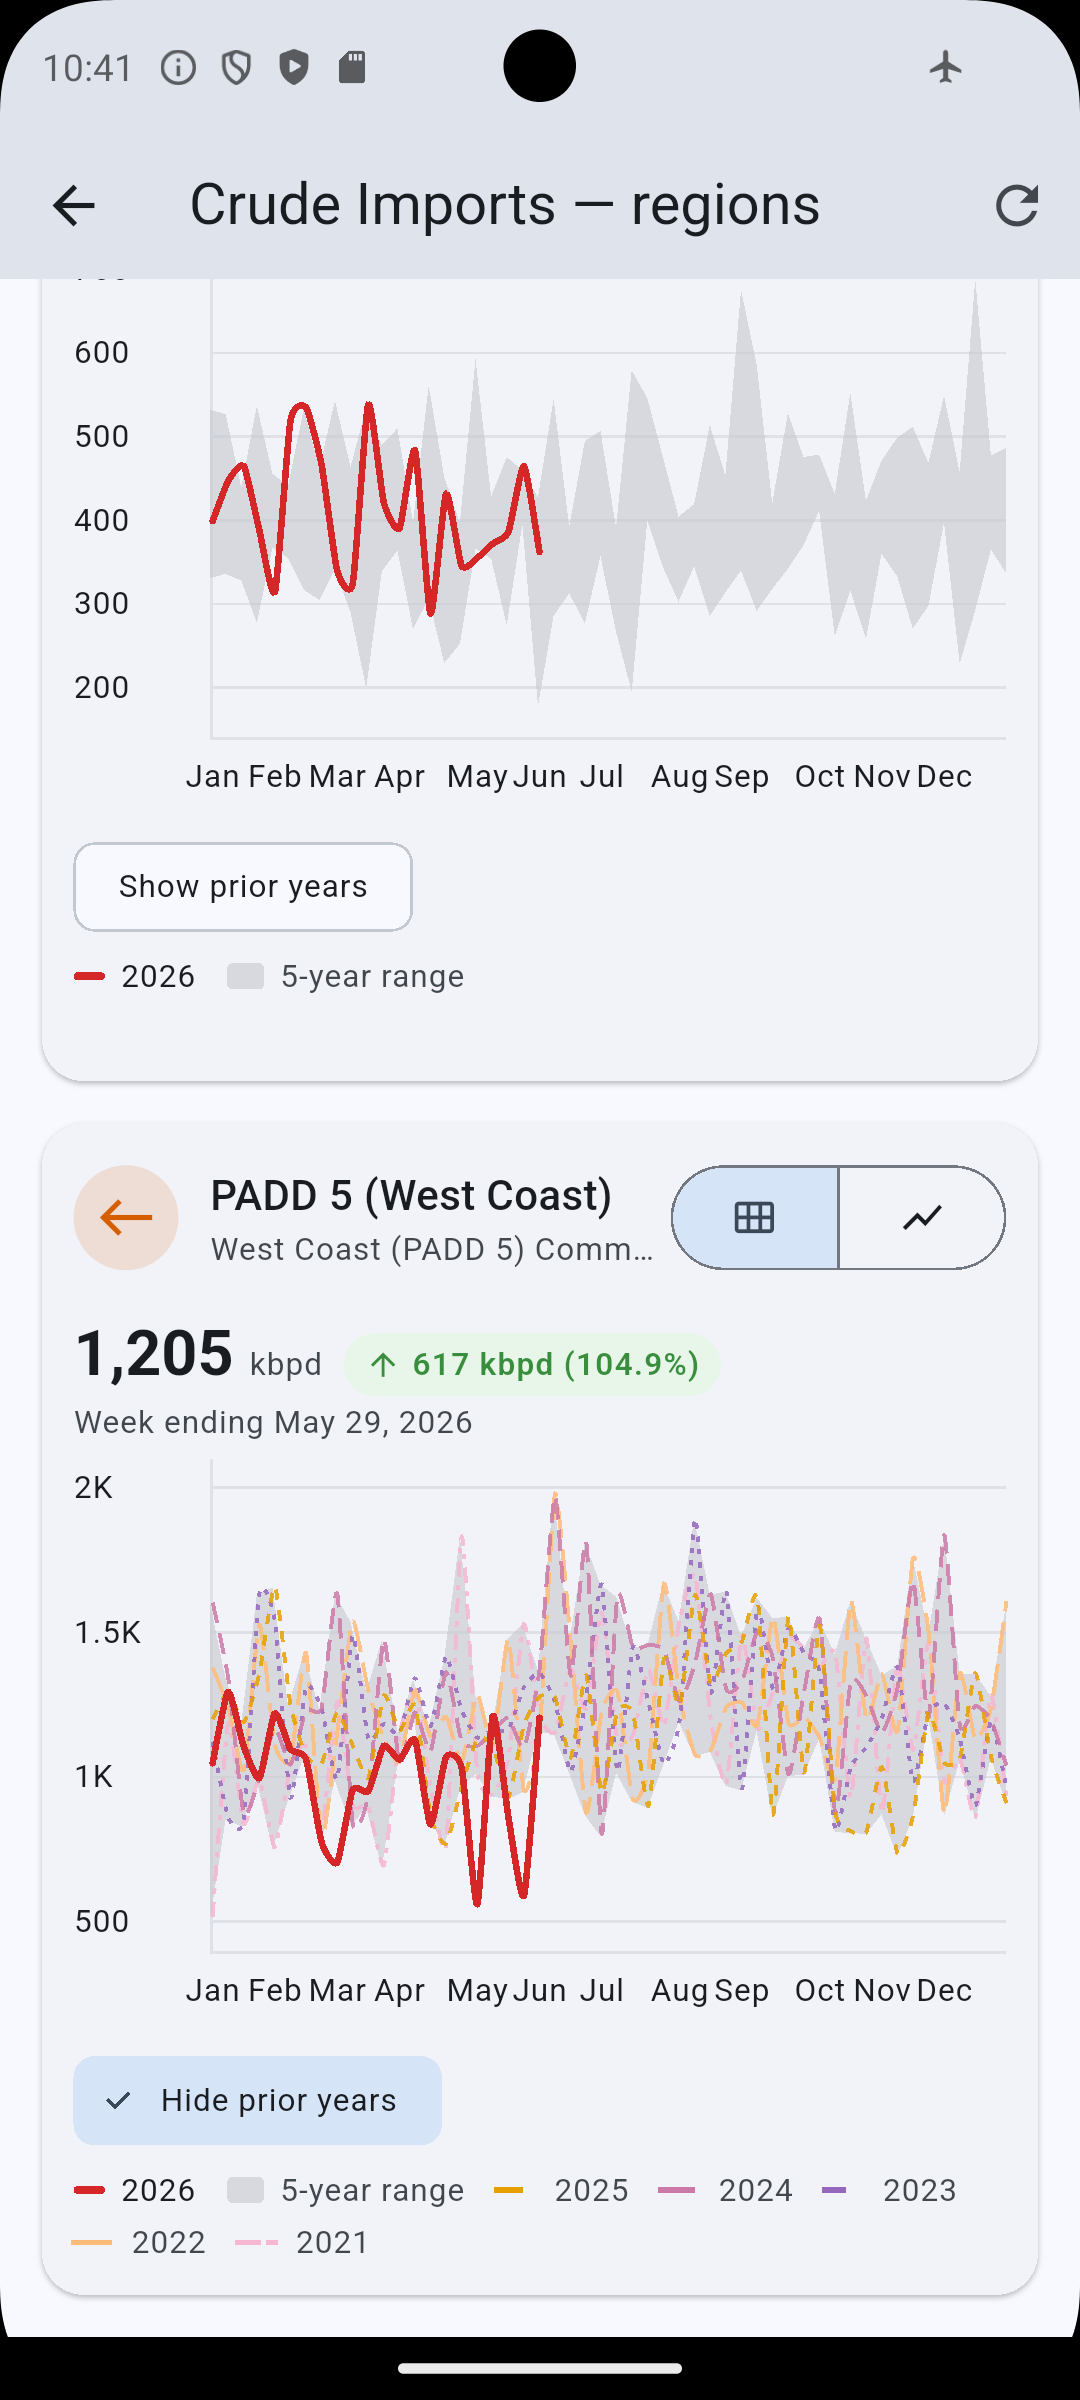
- Regional drill-downs: Crude oil by PADD 1–5, gasoline and distillates by PADD, refinery utilization by PADD, gasoline sub-products (reformulated, conventional, blending components), distillate sulfur grades.
View it your way
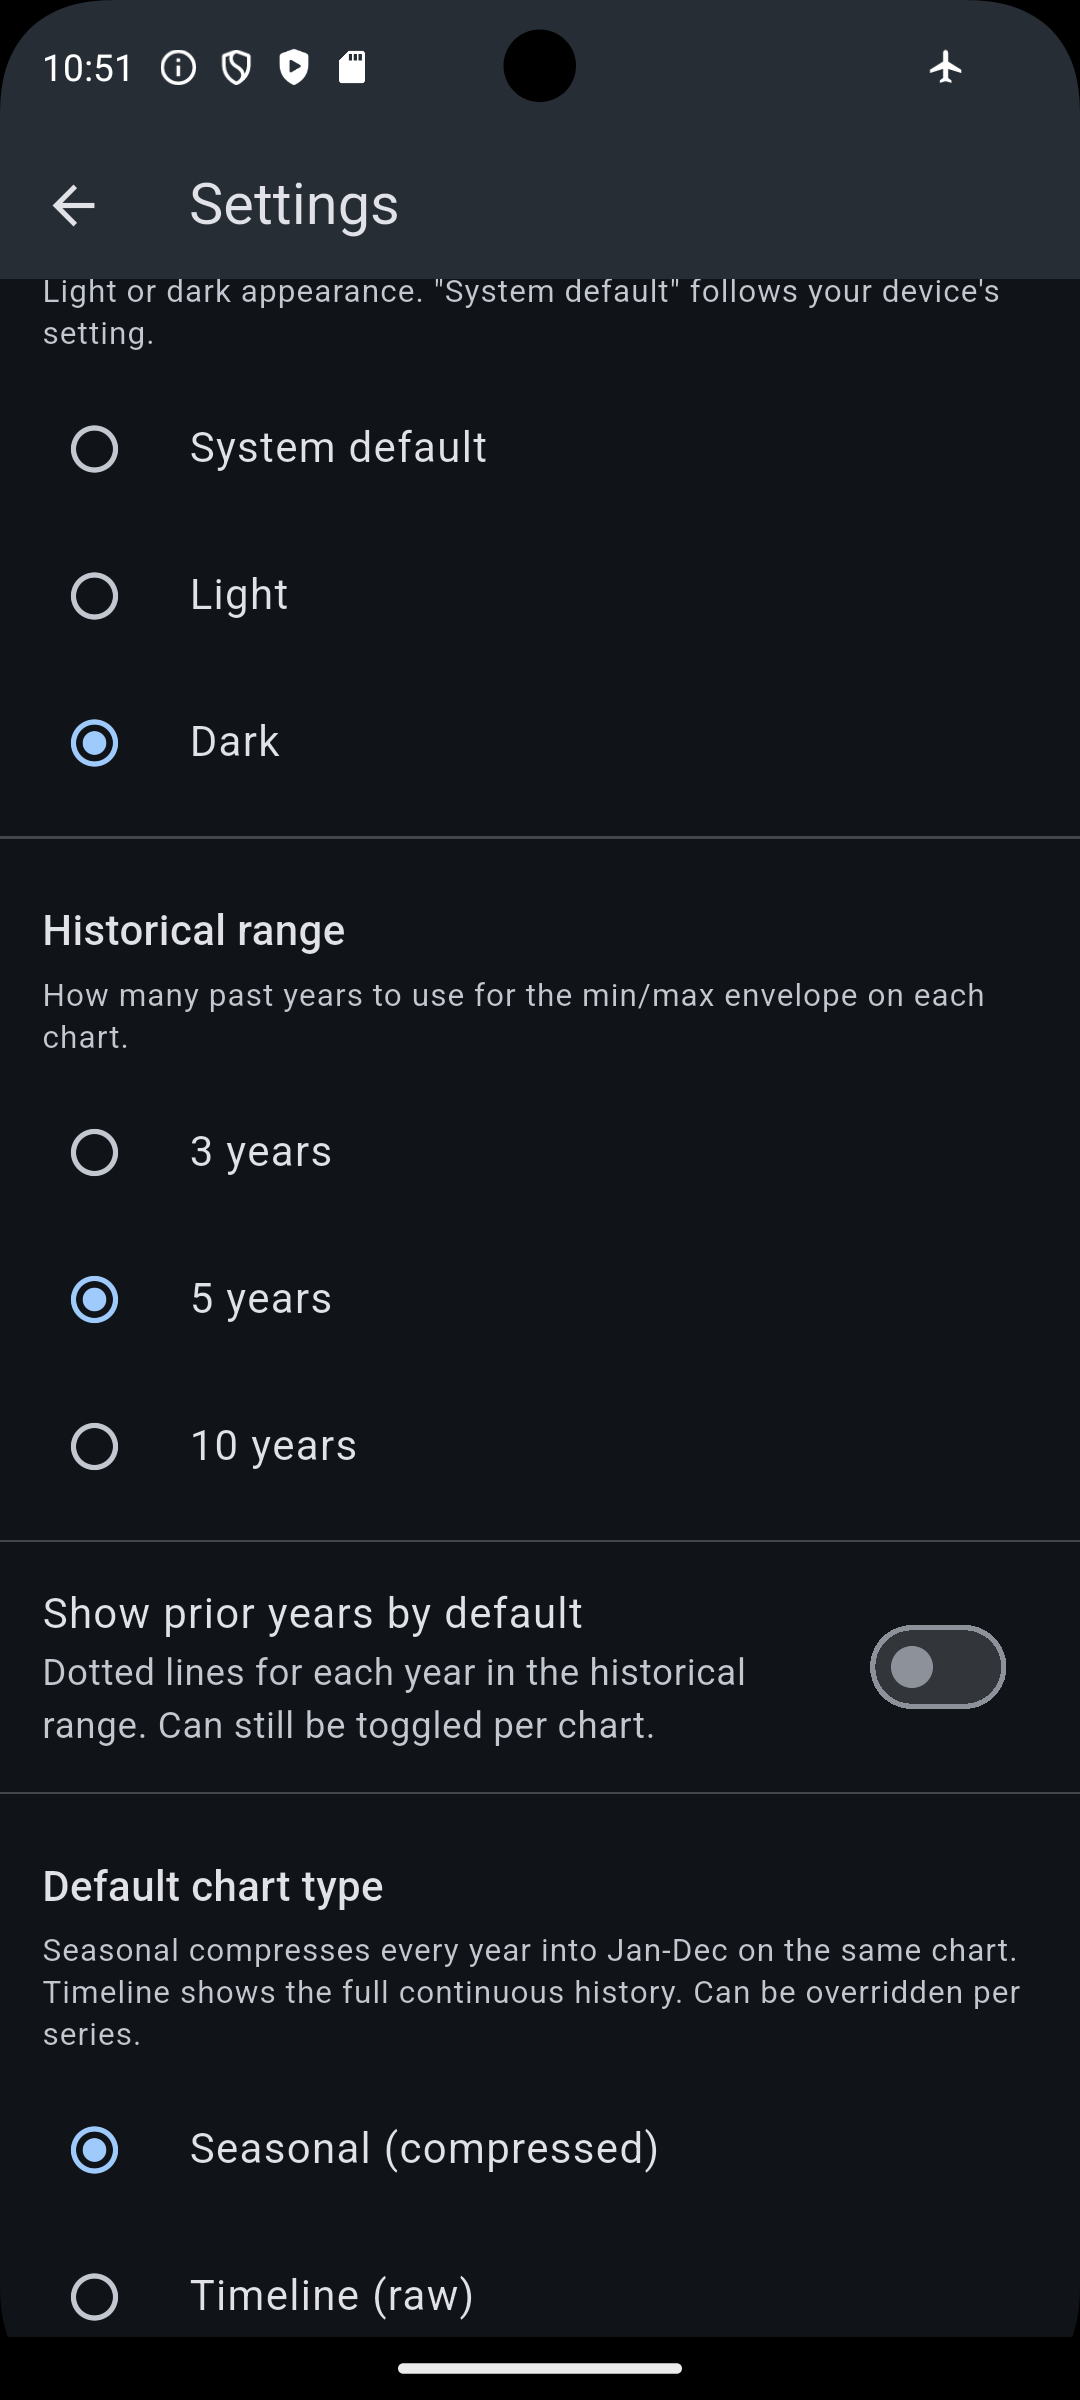
- Seasonal “compressed” charts: current year overlaid on a 3, 5, or 10-year min/max envelope so you can see at a glance whether stocks are above, below, or within the historical range.
- Optional dotted lines for each prior year, color-coded with a legend, so you can compare today against any specific past year.
- Raw timeline view: the full continuous history across all available years.
- Swipe from the left edge for a quick-jump menu listing every series, grouped by category — tap any entry to go straight to its detail view.
- Per-series settings — switch any single card to a different view without affecting the others.
Data source
All numbers come straight from the EIA Open Data API. Released as published, no adjustments. This app is not affiliated with or endorsed by the EIA or any government agency.
Notifications (opt-in)
Get up to two short notifications a week within minutes of each EIA release — one for crude on Wednesday, one for natural gas on Thursday. Off by default; toggle in Settings.
Privacy
No accounts. EIA oil and gas inventories is ad-supported (Google AdMob), and your settings stay on your device — it fetches public EIA data through a thin caching proxy. See the privacy policy for how ads, tracking, and data are handled.
What's new
- Version 1.6.3
- Version 1.6.0
- Version 1.5.0